eco2lot feature · Readings become information

smartcalc

Readings become consumption, volumes, KPIs and new information — automatically and right inside eco2lot. What lives in Excel columns today becomes a live KPI.

  • Consumption and volumes automatically from meter readings
  • KPIs, status times and assignments per order
  • Reuse results as new data points
my.eco2lot.de · smartcalc Current day · hours
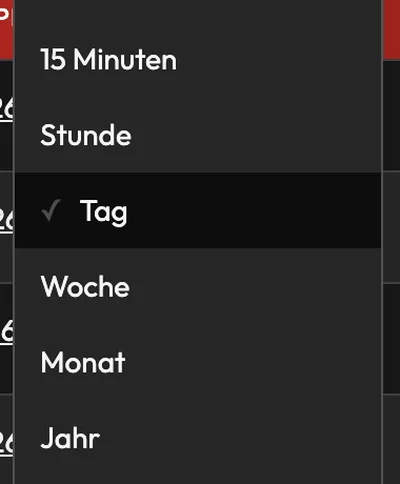
Selection of the resolution in eco2lot: auto, 15 minutes, hour, day, week, month, year, raw data
What is smartcalc in eco2lot?

smartcalc is the central calculation feature in eco2lot. From existing data points and time series, new information arises: consumption from meter readings, volumes, sums across several meters, averages, events, KPIs such as kWh per unit, the duration of operating states, the assignment of energy and volumes to status, order or batch — and freely defined formulas. Every result is itself a data point, counter or KPI again and is available for dashboards, alarms, reports and further calculations — an alarm can be placed on every calculated value, for example when a volume is exceeded or undershot or when a KPI leaves its limit range. This way smartcalc connects data acquisition with analysis.

How it works

smartcalc in one picture

smartcalc in one picture On the left data points such as meter reading, machine status, production volume and readings. They flow into smartcalc with ten calculation types. New values arise: consumption per period, volume per order, KPI kilowatt-hours per unit, status times, sums and formula results. These are used in dashboards, alarms, reports and further calculations. An arrow leads back to the left: every result is itself a new data point. Data points Calculation New values Reuse Meter reading kWh Machine status Production volume Temperature, pressure … smartcalc 10 calculation types 7 evaluation periods calculates continuously Consumption per period Volume per order KPI kWh / unit Status time, sum, formula Dashboard Alarm Report further calculation Every result is itself a new data point
On the left the data points as eco2lot records them. In the middle smartcalc with ten calculation types. On the right the new values and their use in dashboards, alarms, reports and further calculations. The green arrow shows the principle: every result is itself a new data point.
What it looks like

From the calculation to the evaluation

Four views from a demo tenant: the source data point, the calculated values per day and month and the comparison of several periods — all from one single feed counter.

my.eco2lot.de · smartcalc Year-on-year comparison
Three years compared

Month by month side by side: 2024 (blue), 2025 (red), 2026 (green). The table below delivers sum, minimum, maximum and average per year — with no export and no pivot.

Source data point
The raw value: a rising meter reading

The meter reading rises from 1.732 to 1.748 million kWh. The difference is what tells the story — with "Create counter" it directly becomes a feed counter.

Current month · days
The same calculation as daily values

One click on "Current month": consumption per day, the peak on 11 September with 3,534 kWh, the monthly sum in the table.

Comparison mode
Set periods against each other

Activate comparison mode, choose a second date: August against September day by day. Further periods come in via "Add date".

Three groups, ten calculation types

The right tool for every question

What do you want to find out from your data? That decides the calculation type. Three groups order the ten options — and every group answers a different question.

Three groups, ten calculation types Group A counters and volumes answers "How much, how often, how high on average?" with feed counter, volume counter, sum counter, average counter and event counter. Group B analysis and efficiency answers "How efficient, how long, assigned to whom?" with KPI, status time, status to feed and status to volume. Group C free calculation holds the formula for everything beyond the standard calculations. All three groups sit on a shared band: the same data points, the same evaluation periods. A Counters & volumes How much, how often, how high on average? Feed counter Volume counter Sum counter Average counter Event counter B Analysis & efficiency How efficient, how long, assigned to whom? KPI Status time Status to feed Status to volume C Free calculation Beyond the standard calculations Formula Conditions, multi-stage calculations, different time series together Shared basis: the same data points · the same evaluation periods · every result a data point again
Group A counts and measures volumes, group B puts data in relation, group C calculates freely. All three work with the same data points and the same evaluation periods.

Counters & volumes

How much was consumed, produced or counted — and how high was the average? These calculation types turn continuous meter readings and count values into usable volumes.

  • Feed counter: meter reading becomes consumption
  • Volume counter: single volumes become the sum
  • Sum counter: several meters become one total value
  • Average counter: mean value per period
  • Event counter: how often something happens

When you need this: whenever a meter only delivers a total reading and you want to know the consumption of a period.

Analysis & efficiency

How efficiently was production run? How long was a state active? Which volume and which consumption belong to which order? These calculation types put data into a business context.

  • KPI: sum A divided by sum B, e.g. kWh per unit
  • Status time: how long production, setup, standstill lasted
  • Status to feed: consumption per status, order or batch
  • Status to volume: volume per order, product or state

When you need this: when a consumption alone says little and only the relation to production, time or order makes it assessable.

Free calculation

Where standard calculations reach their limit: the formula links any values with mathematical logic, conditions and conversions — across time series with different grids as well.

  • Consumption × energy price = energy costs
  • Grid purchase = total consumption − PV generation
  • Consumption normalization: heat per degree day, electricity per tonne
  • Regression: expected value from influencing variables, baseline for ISO 50001

When you need this: for virtual measuring points, conversions and everything that still sits in an Excel formula today.

In detail

What is inside smartcalc

What smartcalc processes

The starting point is every data point in eco2lot:

  • Continuous meter readings: electricity, gas, water, heat, steam, compressed air
  • Count values and volumes: units, kg, tonnes, litres, m³
  • Status and assignment values: machine state, order, batch, product
  • Readings such as power, temperature, pressure — and already calculated values

Your benefitEverything eco2lot records can be the input of a calculation — the result of another one as well.

What comes out of it

smartcalc delivers finished, business-ready values:

  • Consumption and volumes per period
  • Sums across machines, lines, halls and sites
  • KPIs such as kWh per unit, m³ per tonne, seasonal performance factor
  • Status times as well as consumption and volume per status, order or batch

Your benefitThe number you need in the meeting is ready — instead of being built in Excel the evening before.

Reuse results

Every result is a data point, counter or KPI again:

  • Show in dashboards and compare with other values
  • Monitor with alarms: volume exceeded or undershot, KPI or formula outside the limit range, status time too long
  • Send regularly in reports
  • Use as input for the next calculation

Your benefitCalculations build on each other: meter reading → consumption → KPI → dashboard.

Evaluate over time

All calculation types use the same standardized periods:

  • 15 minutes, hour, shift, day, week, month, year
  • Calculation cycle down to 1 minute — 15 minutes is the market standard; formulas at the pace of the raw data
  • Yearly overview, year-on-year comparison, periods and comparison mode
  • Table with sum, minimum, maximum, average and CSV export

Your benefitOne calculation, seven resolutions — from the minute value to the yearly value.

One level deeper

Building calculations on each other

Calculations in eco2lot always lead further: the result is a new data point — and thus the input for the next stage. Four typical chains from practice:

Building calculations on each other Two chains: a power meter becomes power consumption via the feed counter, a piece counter becomes production volume via the volume counter. Both results flow into the KPI kilowatt-hours per unit, which appears in the dashboard and feeds alarms or reports. Below, a third chain: machine status plus power consumption yield the consumption per status for production, setup and standstill via status to feed. Chain 1 · efficiency per unit Chain 2 · per operating state Power consumption is reused Power meter Data point Feed counter Calculation Power consumption new data point Piece counter Data point Volume counter Calculation Production volume new data point KPI kWh per unit Dashboard Alarm · report Machine status Data point Status to feed Calculation Consumption per status Production · setup · standstill
Chain 1: power meter and piece counter become consumption and volume, both together the KPI kWh per unit in the dashboard. Chain 2: the calculated power consumption is reused and assigned to the machine status.

Production · kWh per unit

Power meter → feed counter → power consumption. Piece counter → volume counter → production volume. Both → KPI: 500 kWh ÷ 1,000 units = 0.5 kWh per unit — per shift, day or month.

Machine status · energy per state

Machine status + power meter → status to feed. Result: production 320 kWh, setup 45 kWh, standstill 28 kWh, fault 12 kWh. The standstill consumption becomes a KPI of its own.

Heat pump · efficiency

Heat meter ÷ power meter → KPI. Per day or month this yields the performance factor of the plant; over the whole year the seasonal performance factor (SPF), e.g. 30,000 kWh ÷ 10,000 kWh = 3.0.

Order · energy and volume per order

Order number + energy meter → status to feed = energy per order. Order number + production volume → status to volume = volume per order. Both together → formula = energy costs per order.

From raw value to decision

Raw data says little. smartcalc gives it meaning.

A meter reading is a number. Only the consumption per shift, the relation to the production volume and the comparison with the previous week turn it into information that carries a decision. smartcalc is the layer in eco2lot where this step happens — continuously, traceably and with no export.

  1. Measured data
  2. Calculation
  3. KPI
  4. Dashboard
  5. Insight
  6. Decision

Calculate instead of export: the results stay in eco2lot, are available to every further feature — and are monitored with alarms like any reading.

Your outcome

Afterwards you can …

  • Consumption and volumes arise automatically from meter readings — for every period.

  • KPIs such as kWh per unit or the seasonal performance factor are available continuously, instead of monthly in Excel.

  • Energy and volumes are assigned to status, orders and batches — the basis for cost allocation and efficiency comparison.

  • You calculate complex relationships by formula right in eco2lot, across time series with different grids as well.

  • Every result is a new data point for dashboards, alarms, reports and further calculations.

  • You place alarms on every calculated value: volume exceeded or undershot, KPI or formula outside the limit range — eco2lot reports it.

Frequently asked questions

What you should know about smartcalc

What is smartcalc?

smartcalc is the calculation feature of eco2lot. From existing data points and time series, new values arise: consumption, volumes, sums, averages, events, KPIs, status times, assignments to status or order and freely defined formulas. The results are available right in eco2lot for dashboards, alarms, reports and further calculations.

What is the difference between a data point and smartcalc?

A data point is a recorded value with history — a meter reading or a machine status, for example. smartcalc calculates with such data points and generates new values from them, for example the consumption per hour. The result is itself a data point again and behaves the same way: with history, in dashboards, with alarms.

Which calculation types are there?

Feed counter, volume counter, sum counter, average counter and event counter (counters & volumes); KPI, status time, status to feed and status to volume (analysis & efficiency); formula (free calculation). Each has its own page with calculation scheme and case in point.

What is a feed counter?

A feed counter evaluates a continuously rising meter reading — typically an electricity, gas, water or heat meter. The consumption of a period is the difference of two meter readings: 10,250 kWh in the evening minus 10,000 kWh in the morning yields 250 kWh. The volume counter works differently: it sums up individually reported volumes.

How is a KPI calculated?

From two counters. For the respective evaluation period, the sum of counter A is divided by the sum of counter B: 500 kWh ÷ 1,000 units = 0.5 kWh per unit. For a day, daily sums are used, for a month, monthly sums — this way KPIs stay meaningful.

Can I calculate a seasonal performance factor with smartcalc?

Yes. A KPI of heat meter divided by power meter yields the efficiency of a heat pump per period. Looked at over a whole year, this is the seasonal performance factor (SPF), for example 30,000 kWh heat ÷ 10,000 kWh electricity = 3.0.

Can smartcalc process complex formulas?

Yes. The formula goes far beyond basic arithmetic: mathematical relationships, conditions, dependencies, conversions and multi-stage calculations can be mapped. Inputs can be data points, counters, KPIs and other formula results.

What happens when time series have different timestamps?

Formulas in smartcalc process time series with different grids together — 15-minute values, hourly values and daily values, for example. eco2lot brings the data together in a time-consistent way for the calculation, even when timestamps or intervals differ.

Can I assign energy to an order or a batch?

Yes, with status to feed. An assignment data point (order, batch, product or machine status) and a continuous meter are considered together. The result is the consumption per order, batch or status. Volumes are assigned accordingly with status to volume.

Can the result of a calculation be reused?

Yes — that is the basic principle. Every result is a data point, counter or KPI of its own and can be shown in dashboards, monitored with alarms, sent in reports or used as the input of the next calculation.

Can I place alarms on calculated values?

Yes, on every one. Because every result is a data point, the same alarms apply as for readings: volume or consumption exceeded or undershot, KPI or formula result outside the limit range, status time too long, remainder counter jumps. The message goes by email or push notification to the right people or teams — with escalation and acknowledgement.

Which periods can be evaluated?

All calculation types use the same standardized periods: 15 minutes, hour, shift, day, week, month and year, plus yearly overview, year-on-year comparison, periods and comparison mode. Calculation happens per time unit, down to 1 minute on request; formulas calculate at the pace of the raw data. The details are on the evaluation periods page.

Do additional calculations cost extra?

Predictable costs: the licence is based on features, independent of the number of data points, counters or calculations. smartcalc is one of the core features of every licence — more data means zero licence penalty.

Is smartcalc the right fit for your task?

Describe your starting point and your goal — we get back to you with a concrete recommendation of matching features and solutions, plus a price indication.

Configure your solution
Esc or click outside to close