eco2lot feature · All devices. All data. One place.

Devices

Your measuring points, machines and plants in one place — with live data, history, alarms, calculations, documents and tasks right at the device.

  • See within seconds which plants are running and where action is needed
  • Digital file: data, analyses, documents and tasks per measuring point, device and plant
  • Connect vendor-independently — receive data and, where possible, send it back
my.eco2lot.de · Devices Device list
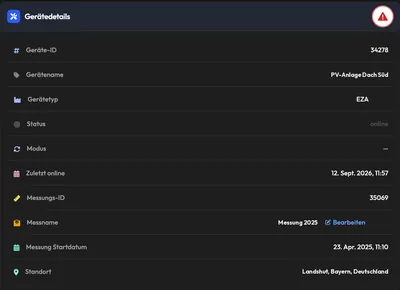
Device details of a PV plant: device ID, device name, device type, status online, last online, measurement ID, measurement name and site
What is a device in eco2lot?

In eco2lot, a device is the central digital image of a technical asset: a measuring point, an energy meter, a machine, plant, heat pump, inverter or IoT device. All information comes together at this device: master data, live data, historical readings, operating states, alarms, analyses and calculations, documents, tasks and the communication with the device itself. The device overview shows the whole portfolio with status, alarms and readings; the detail page is the digital file — all information on your measuring points, devices and plants in one place.

How it works

Data, analyses, documents and tasks — right at the device

The digital file in eco2lot In the centre stands a device, for example a machine, a meter or a heat pump. Eight areas are connected to it: master data, live data, history, alarms, analyses and calculations, documents and notes, tasks and maintenance, and communication in both directions. Device Meter · machine · plant Master data Type · site · ID Live data Status · mode · readings History Time series · measurements Alarms Limits · outage Analyses & calculations Dashboard · smartcalc Documents & notes Manual · wiring diagram · PDF Tasks & maintenance Hints · dates · tickets Communication Receive · send All information on a measuring point, device or plant in one place
Everything comes together at every device: master data, live data, history, alarms, analyses and calculations, documents and notes, tasks and maintenance, and communication in both directions. This turns the device list into a digital file for every measuring point, device and plant.
What it looks like

From the overview into the digital file

Three real views from a demo tenant: the device list as the entry point, the detail page as the digital file and the switch between several measurements of one device.

Step 1 · Overview
What is running, what is stopped, where is the fault?

Alarm symbol, online status, operating mode and actual value stand in every row. Count tiles filter by device type with one click, pinned devices stay at the top, favourites bring the most important plants to the front.

Step 2 · Digital file
The detail page: everything about this device

Master data, output voltage, alarms, voltage per phase, current, power, data points, smartcalc calculations, MQTT identity and linked devices — with different sections depending on the device type. Via "Dashboard" you switch to the graphical view.

Step 3 · Measurements
Several measurements at one device

Via the measurement ID you switch between the measurements of a device — before and after a site change, for example. Measurement name, start date and site belong to the respective measurement; the device stays the same.

How data reaches the device

The ways data gets into the file

Devices send readings and operating data to eco2lot. There they are stored, historized, calculated, visualized and used for analyses. Where an interface is missing, you add values by hand — and smartcalc calculates KPIs from raw data.

Data flow between device and eco2lot in both directions On the left a machine or plant, in the middle the interfaces eco2node, MQTT, OPC UA, Modbus, REST API and M-Bus, on the right eco2lot with dashboards, alarms, smartcalc and reports. An arrow to the right carries readings, status and consumption to the platform. An arrow to the left carries setpoints, parameters and commands back to the device, safety-limited and only where device and interface support it. Below: manually recorded values find their place at the device as well. Machine · plant Meter · heat pump · sensor Interfaces · vendor-independent eco2node MQTT OPC UA Modbus REST API M-Bus → Readings · status · consumption ← Setpoints · parameters · commands safety-limited · where device and interface support it eco2lot stores · keeps history calculates · alerts Dashboards Alarms smartcalc Reports At the device and in the dashboard Manually recorded values — meter readings, test and lab values — land in the same file.
On the left the machine, in the middle the interfaces, on the right eco2lot. The blue arrow brings readings, status and consumption to the platform. The green arrow brings setpoints, parameters and commands back — safety-limited and only where device and interface support it.

Automatically via interfaces

The device delivers its data itself — via the eco2node gateway or directly via open protocols. Which connection fits depends on the device and the manufacturer; the architecture is vendor-independent and open.

  • eco2node on site at meters, controllers and sensors
  • MQTT, OPC UA, Modbus, M-Bus and REST API
  • Every device has its own MQTT identity with access rules
  • Connection monitoring: eco2lot notices when data stops coming

As soon as a device is connected, its file fills itself.

Recorded manually

Many plants still deliver their values by reading them off. That is why devices also take values that someone reads or measures — in the same structure as automatic data.

  • Meter readings read off
  • Test, inspection and lab values
  • Plants with no digital interface as device type "manual"
  • Automatic and manual values in the same analyses

Even the old water meter in the basement gets its digital file.

Calculated with smartcalc

Right in the device details you create calculations that turn raw data into usable information — pure configuration.

  • Power meter + production volume = kWh per unit
  • Machine status + power meter = consumption in production, setup and standstill
  • Feed, volume and sum counters, status times, KPIs, formulas

From the reading to the insight — right at the device.

In detail

What is inside devices

Device overview in real time

The central overview shows all registered machines, plants, energy meters, sensors, heat pumps, PV inverters, IoT devices and controllers.

  • Online or offline — with the time of the last communication
  • Alarm or fault per device as a symbol in the row
  • Active operating mode and current reading next to the reference value
  • Number of stored records per device
  • Count tiles per device type as quick filters

Your benefitSee within seconds which plants are running and where action is needed.

Order and structure

Even with hundreds of devices the portfolio stays clear — through structure, search and personal focus.

  • Asset hierarchy: plant → hall → line → machine → measuring point
  • Linked devices as parents and children — meters under a distribution, for example
  • Search by device ID, name, type, status or tag
  • Favourites and pinned devices for quick access
  • Device types and tags freely definable

Your benefitThe device tree maps your operation — from the plant down to the measuring point.

The detail page as a digital file

One click on a device opens the detail page. Depending on the device type it shows different sections and operating parameters.

  • Master data: ID, name, type, status, mode, last communication, site
  • Current readings such as voltage per phase, current, power, temperatures
  • Data points, alarms and smartcalc calculations right at the device
  • Documents, sticky notes and comments in the device dashboard
  • Link with weather and PV forecast devices

Your benefitYour machines and plants in one place.

Communication in both directions

eco2lot receives data from the device — and, where device, interface and manufacturer support it, sends values back as well.

  • Transfer setpoints and parameters to the device
  • Set operating states and adjust configurations
  • Control commands safety-limited and with rights per user
  • Every write access stays traceable in the log

Your benefitObservation becomes intervention — controlled, limited and documented.

One level deeper

Several measurements per device

A physical device can have several measurements in eco2lot. Every measurement is a period of its own with its own name, start date and site. This way you separate usage situations cleanly — the device stays the same, the whole history is kept in one file.

One device, several measurements on the timeline On the left a device with a fixed device ID. On the right a timeline from 2023 to 2027 with three bars: measurement 1 at the Landshut site from 2023 to mid-2024, measurement 2 at the Hamburg site until 2025, measurement 3 with the new operator from 2026. All three measurements belong to the same device, the history is kept in full. Machine A Device ID 12973 · stays the same one digital file 2023 2024 2025 2026 2027 Timeline Measurement 1 Site Landshut · hall 1 Measurement 2 Site Hamburg · line 3 Measurement 3 new operator · from 2026 Evaluate separately, compare together — the device stays the same.
Machine A keeps its device ID. Measurement 1 belongs to the Landshut site, measurement 2 to the Hamburg site, measurement 3 to the new operator. Every measurement is evaluated separately and stays comparable with the others.

Site change

A machine moves from plant A to plant B. The old measurement ends, a new one begins — with a new site. Both stay retrievable at the same device.

Change of owner or operator

A device changes owner or is handed over to another customer. The new measurement starts clean, the history stays traceable.

Use in another plant

A measuring case or mobile meter measures different plants one after another. Every plant gets its own measurement — the device stays the same.

Compare periods

Before and after an optimization, season by season or order by order: separate measurements make periods directly comparable.

From the reading to the action

At the device, data becomes operational work

An anomaly in energy consumption catches the eye. You open the device, see curve, alarm and operating state, recognize the cause — and from this a task or a ticket in your system arises. The maintenance is carried out, the result documented as a note or log at the device. Everything in one place, everything traceable.

  1. Data
  2. Anomaly
  3. Insight
  4. Task
  5. Action
  6. Documentation

Tickets reach your existing systems via integrations too — by webhook, Microsoft Teams or n8n.

Cycle at the device: from data via anomaly, insight, task and action to documentation The device in the centre. Around it in a clockwise circle six stations: data, anomaly, insight, task, action, documentation. The documentation flows back into the data of the device, so everything stays traceable. Device everything in one place Data reading comes in Anomaly alarm · deviation Insight cause at the device Task note · ticket Action maintenance · setpoint Documentation note · log
Your outcome

Afterwards you can …

  • You see within seconds which device is running, stopped or faulty.

  • The device tree maps your operation — from the plant down to the measuring point.

  • From the conspicuous device it is two clicks to the cause — documents and history sit right next to it.

  • Site and operator changes stay traceable while the device stays the same.

  • Where device and interface allow it, you send setpoints back safety-limited.

Frequently asked questions

What you should know about devices in eco2lot

Which devices can eco2lot manage?

Everything that measures, counts or controls: energy meters, machines and controllers, sensors, heat pumps, PV inverters, charging points, gateways and other technical assets. You define device types yourself; plants with no interface are created as a manual device.

How are devices connected?

Via the eco2node gateway on site or directly via open protocols such as MQTT, OPC UA, Modbus, M-Bus and REST API. Which connection fits depends on the device and manufacturer — the architecture is vendor-independent. Every device receives its own MQTT identity with access rules.

Does eco2lot notice when a device stops delivering data?

Yes. Connection monitoring reports missing data per device. In the overview the status switches to offline, the time of the last communication stays visible — this way silent outages catch the eye before gaps appear in the analyses.

Can eco2lot send values back to a device as well?

Where device, interface and manufacturer support it, yes: setpoints, parameters, operating states and control commands go back to the device. This happens safety-limited, with permissions per user and a log of every write access.

What happens when a device changes site or owner?

You start a new measurement at the same device with its own name, start date and site. The previous measurement is kept in full. This way you separate periods cleanly and still compare them — the device stays the same.

Can I store documents right at the device?

Yes. Operating manuals, data sheets, wiring diagrams, pictures, certificates and test reports sit as file attachments at the device dashboard; sticky notes and comments complete them. Data and documentation thus sit in the same file.

Can I connect maintenance, tasks and tickets with a device?

Yes. Hints, maintenance dates and tasks are recorded as notes and comments at the device; the maintenance history belongs in the wiki. Tickets reach your existing systems via integrations — by webhook, Microsoft Teams or n8n, also automatically from an alarm.

Can I record manual readings as well?

Yes. Meter readings read off, test, inspection and lab values are entered at the device. They are stored in the same structure as automatic data and are available on equal terms in dashboards, calculations and reports.

Are Devices the right fit for your task?

Describe your starting point and your goal — we get back to you with a concrete recommendation of matching features and solutions, plus a price indication.

Configure your solution
Esc or click outside to close