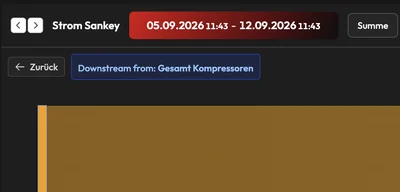
Sankey diagram – the flows of one level
Source, intermediate nodes, consumers: the Sankey shows how a total amount is distributed across areas and machines – for the selected period.
- Grid supply → presses · cooling system · compressors → individual machines
- Choose the period and page through it, aggregation “Sum”
- Name nodes freely: plant, hall, line, machine, medium
- Values from data points, meters and smartcalc