eco2lot feature · Reliable data, point by point

Data points

Every reading with history, context and quality. eco2lot turns individual raw values into a reliable basis for analyses, KPIs and decisions.

  • See within seconds which readings are currently arriving and which you should look at more closely
  • History as live chart or table — with zoom, period, statistics and CSV export
  • Maintain data quality actively: filter measurement errors, correct values, comment on causes
my.eco2lot.de · Data points Data point directory
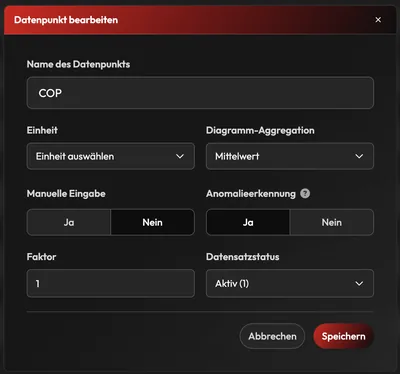
Dialog edit data point: name COP, unit, chart aggregation average, manual input yes/no, anomaly detection yes, factor 1, record status active
What is a data point in eco2lot?

A data point is the smallest central unit of information in eco2lot: a single measured or process value such as temperature, voltage, current, power, pressure, flow, meter reading, machine status, production volume, setpoint or KPI. eco2lot takes these values from the connected devices, stores them as a time series (every value with a timestamp) and makes them available for analyses, calculations, dashboards, KPIs, alarms and smartcalc. Every data point carries history, context (name, unit, factor, tags) and quality (filters, correction, comments) — and shows where it is used further.

How it works

A data point is more than a reading

Anatomy of a data point in eco2lot In the centre stands a data point, for example a temperature or a power value. Four layers are connected to it: the history as a time series with timestamps, the context with name, unit, factor, tags and group, the quality with blacklist filter, data editor, comments and anomaly highlighting, and the usage in counters, formulas, KPIs, dashboards, alarms and reports. History Time series · every value with timestamp Raw data and resolutions Period, zoom, statistics Chart or table CSV export Context What the value means Name, unit, factor Display unit (Wh → kWh) Tags and groups Device and site Quality Reliable instead of merely stored Blacklist filter Data editor Comments at the measuring point Highlight anomalies Usage Where the value works on Counters and formulas KPIs Dashboards and alarms Reports, Sankey Data point Temperature · power Meter reading · status · KPI … Only together does the raw value become reliable information.
In the centre the data point. Around it four layers: the history as a time series, the context (name, unit, factor, tags, group), the quality (filters, correction, comments, anomalies) and the usage in counters, KPIs, dashboards and alarms. Only together does the raw value become reliable information.
What it looks like

From the directory into the time series

Real views from a demo tenant: one click on a data point opens its live chart. From there you switch to the data table, adjust display and unit, comment, correct, filter and enter values by hand.

my.eco2lot.de · Data points Live chart · detail view
The detail view: the history as a live chart

Open a data point and you first see its live chart: the complete history as a time series. Choose the period, show raw data or a coarser resolution, zoom in and out, add further data series. Below, the statistics with minimum, maximum, average, sum and number of values. With "Create counter" the data point directly becomes a smartcalc calculation.

Data table
Chart or table

The same values in table form: timestamp, reading and comment per row — ideal for checking individual values precisely. Deleted values have a table of their own. With one click you download the period as CSV.

Series configuration
Display and unit per data series

Points, line, points + line or area; colour, Y min, Y max. Separate base unit and display unit: the device delivers Wh, the display converts to kWh — the stored raw values stay unchanged.

Edit data point
Configure every data point individually

Name, unit, factor, chart aggregation, manual input, anomaly highlighting and record status. The factor adjusts incoming raw values automatically — when a meter delivers pulses instead of kilowatt-hours, for example.

Comment · data editor
Comment or correct — right in the curve

One click on a measuring point opens the dialog: attach a comment to a point in time or a period ("sensor replaced", "test operation") — or take single and multiple faulty values out of the time series with "Delete points".

Blacklist rules
Filter out measurement errors automatically

Rules for unwanted values: less than, greater than, equal to. If a sensor always delivers −999 on communication errors, this value is filtered out before it reaches counters, KPIs or dashboards.

Manual input
Enter values by hand

Data point, timestamp, value — several rows at once. Meter readings read off, test and lab values land in the same time series as automatically received data and pass the same filter rules.

Maintain data quality actively

Raw values become a reliable data base

Sensors fail, connections drop, test values land in the live system. eco2lot stores readings and gives you three tools to secure the quality of every time series — before, during and after storage. The raw data is kept; deleted values sit in a table of their own.

Path of a reading from raw value to reliable time series On the left a device delivers a raw value. It passes three stages: blacklist rules filter out known error values such as minus 999, factor and display unit bring the value to the right magnitude, data editor and comments correct and explain outliers. On the right stands the reliable time series on which counters, KPIs, dashboards and alarms calculate. The stored raw data is kept, deleted values sit in a table of their own. Device delivers raw value A · Filter Blacklist rules < X · > X · = X before processing Adjust Factor & display unit Pulses → kWh · Wh → kWh raw value stays stored B · C · Correct Data editor & comments Delete outliers note the cause −999 · sensor error filtered out, kept out of every analysis Deleted values own table, traceable Reliable time series Counters KPIs Dashboards Alarms Data quality in eco2lot Filter, adjust, correct — the raw data is kept, the analyses calculate on clean values. All rules apply per data point and cover manually entered values as well.
From left to right: the raw value comes from the device. Blacklist rules filter known error values, factor and unit bring it to the right magnitude, data editor and comments correct and explain outliers. On the right stands the reliable time series on which counters, KPIs and dashboards calculate.

Filter — before errors travel on

With blacklist rules you define per data point which values count as measurement errors. They are detected and excluded from further processing.

  • Value less than X · greater than X · equal to X
  • Example: −999 on communication error, 0 on sensor failure
  • Applies to manually entered values as well
  • Raw data is kept, filtered values stay out of every analysis

Detect measurement errors automatically and exclude them from data processing.

Correct — right in the time series

The data editor works in the live chart: select one or more measuring points and delete them — with no export and no database access.

  • Sensor and communication errors, false peak values
  • Test values and faulty manual entries
  • Single point or period (multiple selection)
  • Deleted values stay traceable in the "deleted data table"

Correct faulty values before they distort later analyses.

Document — why a value changed

Comments attach directly to the measuring point or period. Whoever looks at the curve later finds the explanation exactly where it is needed.

  • "Production standstill due to maintenance"
  • "Sensor was replaced" · "Test operation" · "Cleaning of the plant"
  • "Unusual consumption due to special production"
  • Can be shown and hidden in the live chart, visible per row in the data table

See what happened — and record why.

In detail

What is inside data points

The data point directory

All data points in one place — as a tree along your sites, plants and devices. Even thousands of measuring points stay structured this way.

  • Per row: status, last timestamp, last value, number of records received today
  • Pinning: important data points stand at the very top of the overview
  • Tags and groups — temperature, electricity, water, pressure, effort, yield, production, status, for example
  • Search by data point ID, name, device name or tag; favourites for quick access
  • Manual input with timestamp and value right in the row

Your benefitSee within seconds which readings are currently arriving and which you should look at more closely.

Configure and convert units

Every data point has its own parameters. This way it fits its device — and the people who work with it.

  • Name, unit, factor, chart aggregation, record status
  • Factor: adjust incoming raw values automatically, pulses into kilowatt-hours, for example
  • Convert the display automatically into the desired unit — Wh → kWh, W → kW, Pa → bar, litres → m³
  • Switch anomaly highlighting on or off per data point
  • Enable manual input per data point

Your benefitThe device delivers what it delivers — you read the quantity you need. The raw values stay stored unchanged.

History as chart or table

The detail view of a data point is its live chart. A switch leads to the data table with the same values.

  • Choose the period freely, raw data or coarser resolution, zoom in and out
  • Display: points, line, points + line, area; colour, Y min, Y max per series
  • Add further data points and smartcalc values as series
  • Statistics: minimum, maximum, range, average, sum, number of records
  • Data table with timestamp, value and comment per row; search and CSV export

Your benefitCurve for the pattern, table for the single value — both from the same time series.

Record manually and send values back

Values with no digital interface you enter by hand. And where device and interface support it, values go back to the device as well.

  • Manual input: data point, timestamp, value — several rows at once as well
  • Meter readings read off, test, inspection and lab values in the same time series as device data
  • Send back setpoints, parameters, releases or operating states — safety-limited
  • Only to approved data points, with permission per user and a log of every write access

Your benefitDevice → reading → eco2lot. And eco2lot → setpoint → device, where the plant allows it.

One level deeper

Relationships: you see the value — and what it is used for

A data point rarely stands alone. In eco2lot it is visible which counters, formulas, KPIs, status times, dashboards and smartcalc calculations it is connected with (data relationship). This counts especially when you change, replace or analyse a data point: you know beforehand what depends on it.

Relationships of a data point in eco2lot The data point electrical power feeds an energy counter. The energy counter and the second data point production volume together yield the KPI kilowatt-hours per unit. The KPI appears in a dashboard and triggers an alarm when exceeded. Dashed arrows point back: every stage knows the data point it originated from. Data relationship · where a data point is used Data point Electrical power kW · time series Data point Production volume units · time series Energy counter Sum counter · kWh smartcalc KPI kWh per unit Formula: counter ÷ volume Dashboard Tile · trend per shift Alarm at > 1.8 kWh/unit points back to the origin: every stage knows its data point Before a change you see which counters, KPIs, dashboards and alarms depend on a data point.
The data point "electrical power" feeds the energy counter, the energy counter and the production volume yield the KPI kWh per unit, the KPI lands in the dashboard and triggers an alarm when exceeded. Every stage points back to its origin.

Counters

Feed, volume and sum counters calculate continuously on a data point — the counter knows its source, the source knows its counters.

Formulas and KPIs

Free formulas and KPIs combine several data points, power meter + piece count = kWh per unit, for example. The relationship shows all values involved.

Dashboards and alarms

Which tiles, curves and alarm rules use this data point? The answer stands at the data point — instead of in a search through all dashboards.

Change and replace

When a sensor is replaced or a data point renamed, you see beforehand which calculations and views depend on it — and adjust them precisely.

From data point to insight

Clean data points are the basis for reliable decisions

A reading comes in and becomes part of a history. A counter sums it up, a KPI puts it in relation to production, a dashboard shows the trend — and from this arises the insight that carries a decision. Every one of these stages is only as good as the data point it starts with. That is why in eco2lot you maintain quality where it originates: point by point.

  1. Reading
  2. History
  3. Counter
  4. KPI
  5. Dashboard
  6. Insight

Power value + production volume → KPI kWh per unit: two data points, one formula, one dashboard — that is the typical path in eco2lot.

From data point to insight Six stages: a reading comes in, becomes part of a history, a counter sums it up, a KPI puts it in relation, a dashboard shows the trend, and from this arises the insight that carries a decision. Below, the example: power value plus production volume yield the KPI kilowatt-hours per unit, which appears in the dashboard. Every stage is only as good as its data point Reading comes in History time series Counter sums up KPI puts in relation Dashboard shows the trend Insight carries the decision Example · two data points, one formula Power kW + Production volume units kWh per unit Dashboard
Your outcome

Afterwards you can …

  • All readings organized centrally — important data points in view immediately, pinned, tagged, grouped.

  • Every history checkable as live chart or table, with statistics and CSV export.

  • Measurement errors are filtered out automatically, outliers corrected, causes commented — the raw data is kept.

  • Units and factors adapt the raw value to your language: kWh instead of Wh, bar instead of pascal.

  • You see what a data point is used for — before you change or replace it.

Frequently asked questions

What you should know about data points in eco2lot

What is a data point?

The smallest unit of information in eco2lot: a single measured or process value, stored as a time series — every value with its timestamp. It includes name, unit, factor, tags, quality rules and the relationships to calculations and dashboards.

Which values can be recorded as a data point?

Everything a device measures, counts or reports: temperature, voltage, current, power, pressure, flow, meter reading, machine status, production volume, setpoints, KPIs and further measured or process values — automatically via interfaces or entered manually.

How do I recognize whether a data point still delivers data?

In the data point directory every row shows the last timestamp, the last value and the number of records received today. If the number stays at 0 or the timestamp is old, you see it immediately — an alarm on missing data reports it in addition.

Can I group, tag or pin data points?

Yes. Data points sit as a tree along your sites and devices, can be given tags such as temperature, electricity, water or production, ordered into groups, marked as favourites and pinned — pinned data points stand at the very top of the overview.

Can I correct or delete readings afterwards?

Yes. In the live chart you select one or more measuring points and delete them with the data editor — sensor errors, false peak values or test values, for example. Deleted values stay traceable in a table of their own.

How are faulty readings filtered out automatically?

Via blacklist rules per data point: values less than, greater than or equal to a value are detected and excluded from further processing. If a sensor always delivers −999 on communication errors, this value stays out of every analysis.

Can I attach comments to historical data?

Yes. Comments attach directly to a measuring point or a period — for example "sensor was replaced" or "production standstill due to maintenance". They can be shown in the live chart and are visible per row in the data table.

Can I convert units automatically?

Yes. Per data series you define base unit and display unit: the device delivers Wh, kWh is displayed; W becomes kW, pascal becomes bar, litres become cubic metres. The display converts, the stored raw values stay unchanged. A factor additionally adjusts raw values, pulses into kilowatt-hours, for example.

Can eco2lot send values back to devices?

Where device, interface and configuration support it, yes: setpoints, parameters, releases or operating states go back to the device. This happens safety-limited — only to approved data points, with permission per user and a log of every write access.

How do I see where a data point is used?

Via its relationships: eco2lot shows which counters, formulas, KPIs, status times, dashboards and smartcalc calculations build on the data point. This way you know before a change what depends on it.

Can I view the data as table or chart — and export it?

Both. The detail view opens as a live chart; a switch leads to the data table with timestamp, value and comment per row. You download the chosen period as CSV.

Do more data points cost more?

eco2lot is licensed by feature scope — independent of the number of data points, tags, devices or the data volume. Predictable costs, with zero licence penalty for more data: you connect what you want to measure.

Are Data points the right fit for your task?

Describe your starting point and your goal — we get back to you with a concrete recommendation of matching features and solutions, plus a price indication.

Configure your solution
Esc or click outside to close