eco2lot feature · From data to insights

Dashboards

From the single machine to the whole company: assemble exactly the information you need for your task — as a device, team, site or company dashboard, completed by your personal favourites.

  • Dashboards per device, team, site and company
  • Personal favourites for every user
  • Combine analysis tools freely — pure configuration
my.eco2lot.de · Dashboards Device dashboard
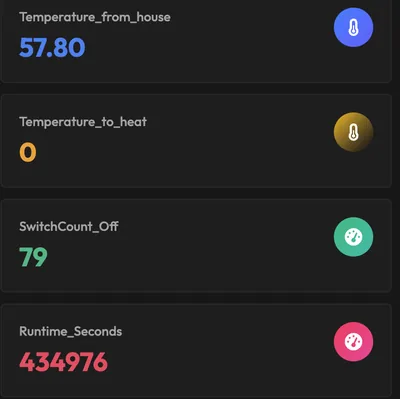
KPI tiles: flow temperature, switching cycles and operating seconds as live values
What are dashboards in eco2lot?

Dashboards in eco2lot assemble from energy, machine, building and production data exactly the information a person needs for their task. They exist on every level: for a single device, for teams and departments, for sites and for the whole company. Every user adds personal favourites. Which tools a dashboard contains — live charts, tables, heatmaps, load duration curves, comments — is decided by the task, not by the technology.

Where to start

Everyone needs different information

A machine operator needs different information than an energy manager. eco2lot collects all data centrally — and every role gets the view its work requires.

Production management

Machine states, production volumes and downtimes of their own department — at a glance, shift by shift.

Energy management

Consumption, load peaks and energy KPIs of the site, including comparison with the previous month and the target.

Maintenance

Operating hours, faults and anomalies per plant — plus the documents that belong to the plant.

Executive management

Condensed KPIs across departments, plants and the whole company — comparable and free of detail noise.

With eco2lot, everyone gets exactly the view of the data that is relevant for their task.

What it looks like

One dashboard per level — device, site, company

Three real dashboards from a demo tenant. They show how the same data base is assembled differently depending on the task: for the energy team, for the site and for a single device.

Energy team
Energy dashboard of the energy team

Year-on-year comparison, phase currents and savings rate — the energy manager sees consumption and load peaks of the site with no detour through Excel.

Site
Site dashboard: generation and purchase

Weather, PV forecast, feed-in and live energy flow between grid, solar, storage and plant — the overview for site management.

Device + notes
Device dashboard with notes and documents

Readings, colleagues' sticky notes and the operating manual as PDF — right at the device. This is how the dashboard becomes a shared workspace.

Where and for whom

Three kinds of dashboards — one data base

Dashboards define where and for whom information is assembled. From the single plant to the whole company, data is condensed and combined step by step.

Dashboard levels in eco2lot Four levels from bottom to top: many device dashboards, above them team and department dashboards, then site dashboards and at the very top one company dashboard. Data is condensed upwards. To the right: "My favourites" as a personal selection from all levels. condense combine compare Device Machine · plant · meter Team / department Line · energy · service Site Plant · building Company Sites compared My favourites Heat pump HP-02 Energy · Hall 3 Site South Group KPIs Maintenance week Personal selection from all levels
Bottom up: device dashboards roll up into team, site and company dashboards. Personal favourites reach every level.

Dashboards on device level

Every machine, plant or any other device can have its own dashboard. Whoever opens a heat pump, a production machine or a power distribution immediately sees the associated dashboard.

  • Current readings and states
  • Energy and media consumption
  • Production volumes and KPIs
  • Historical curves
  • Anomalies and faults

The relevant information sits right where it originates.

Team, site and company dashboards

Several devices and data sources are combined into higher-level dashboards: for a production line, a department, energy management, maintenance, a site or several plants.

  • Production management: all important machines of the department
  • Energy management: energy consumption of an entire site
  • Executive management: several sites in direct comparison

From the single plant to the whole company — data is condensed step by step.

Personal dashboards and favourites

In addition, every user assembles important information, frequently used analyses and relevant machines as personal favourites. This creates an individual workspace.

  • Favourites from all levels
  • Own analyses and views
  • Quick access to frequent tasks

Every user can additionally assemble their very personal view of eco2lot.

In detail

What is inside Dashboards

Flexible permissions

For every dashboard you define who may view, use, edit or manage it — per person or per team.

  • View: read values and leave everything unchanged
  • Use: choose periods, filter, zoom
  • Edit: add and arrange blocks
  • Manage: grant shares and rights

Your benefitEveryone sees exactly the information intended for their task.

Share dashboards easily

An energy manager creates a new analysis and shares it with production management, maintenance and executive management.

  • Share with individual users or whole teams
  • Permissions stay intact when sharing
  • Changes are visible to everyone involved immediately
  • Link to the dashboard for meetings and reports

Your benefitEveryone involved works on the same data base — discussions revolve around actions instead of numbers.

On every device

Dashboards run in the browser — on the desktop PC, notebook, tablet and smartphone, on the hall monitor and in the control room.

  • Full-screen mode free of controls for large screens
  • Permanent display in production, control room, energy centre or plant room
  • Automatic data refresh
  • The same view on the phone while on the move

Your benefitThe right numbers hang where decisions are made — free of printouts and email attachments.

A shared workspace

A dashboard in eco2lot is more than a collection of charts. Live data, historical time series, KPIs, analysis tools, sticky notes, comments and file attachments come together here.

  • Data is connected with assessments and knowledge
  • Causes and actions stay documented at the dashboard
  • Different data sources in one view
  • From the insight straight to alarm, report or task

Your benefitThe visualization becomes a shared information and work space.

How data is evaluated

Tools for analysis and visualization

Depending on the question, you combine different tools in one dashboard. From the simple time series to the load analysis, eco2lot provides matching tools for different tasks — each with its own detail page.

An eco2lot dashboard as a kit of blocks A dashboard window with seven labelled blocks: KPI, live chart, table, heatmap, load duration curve, comment and sticky note. Each block is a tool of its own, combined depending on the task. my.eco2lot.de · Energy dashboard Hall 3 KPI 142 kW Power now · target < 150 kW Live chart Load duration Peaks Base load Table AssetkWh/daykWh/unit Press 11,2400.42 Press 21,3100.47 Chiller860— Compressor 2520— Heatmap Mon–Sun × hours · dark = high load Comment EM · today 09:12 Peak Mon 06:30 = start-up compressor 2. Check. Write a reply … Service P3 on 18 Sep Check filter first – EM Sticky note One dashboard = blocks chosen by task. Combine tools freely: what is shown is decided by the task – not by the technology. All values: demo data
Example dashboard built from seven blocks — each block is a tool you combine depending on the task.
One level deeper

Make correlations visible

The value of a dashboard arises when different data sit side by side. Three examples show why displaying them together reveals more than the single reading.

Example energy dashboard

Current power consumption, load peak, consumption of individual plants, production volume, energy per unit, daily/monthly/yearly curve and comments — on one page. This makes visible whether higher consumption came from more production or a plant is working inefficiently.

Example production dashboard

Machine status, production volume, setup times, downtimes, faults, energy consumption and KPIs together. Correlations emerge that stay hidden when single readings are viewed in isolation — such as downtimes that coincide with a high base load.

Example building dashboard

Outdoor temperature, flow temperature, heat consumption and room climate per building. The facility manager sees whether the heating curve matches the weather and where rooms are overheated.

From data to decisions

eco2lot brings the right information to the right person

eco2lot collects energy, machine, building and production data centrally. The dashboards bring exactly the information to the screen that a task or decision requires. This creates a continuous process — whether single machine, department, site or whole company.

  1. Data
  2. Information
  3. Insights
  4. Decisions
  5. Actions

And because eco2lot also acts: an insight in the dashboard becomes an alarm, a control strategy or a report with one click.

From data to action with eco2lot dashboards On the left, meters, machines, buildings and sensors deliver data to eco2lot. A dashboard turns it into the information for one task. Insight, decision and action follow, for example an alarm or a new setpoint. Below, the chain: data, information, insights, decisions, actions. Meters Machines Buildings Sensors Data sources eco2lot one data base 142 kW Dashboard for the task Cause found Insight Alarm Setpoint Report Task Actions Data Measure Information Combine Insights Understand Decisions Decide Actions Act
Your outcome

Afterwards you can …

  • Understand data faster — every role sees its view when logging in.

  • Recognize correlations and make anomalies visible instead of comparing single values.

  • Compare departments and sites on one data base.

  • Make decisions based on real data and trigger the action directly.

  • Use information together as a team — with notes, comments and documents at the dashboard.

Frequently asked questions

What you should know about Dashboards

What is the difference between dashboards and analysis tools?

Dashboards determine which information is assembled for a task or organizational level — device, team, site, company or personal favourites. Analysis tools determine how this data is evaluated: as a live chart, table, MultiChart, load duration curve or heatmap. Sticky notes, comments and file attachments add the collaboration layer.

Can every user create their own dashboards?

Yes. Every user designs their own dashboards and arranges them as favourites. On top come shared dashboards for teams, sites and the company. Who may view, use, edit or manage what is defined per dashboard.

Do I need programming skills for this?

Dashboards are built with a kit of blocks: choose the tool, assign the data point, set the position. Live charts, tables and heatmaps are pure configuration as well.

What happens to the permissions when sharing?

The permissions stay intact. Whoever may only view a dashboard still sees it read-only after sharing. Editing and managing remain reserved for the people approved for it.

Are the dashboards suitable for hall monitors and control rooms?

Yes. The full-screen mode is designed for large screens in the hall, control room, energy centre and plant room — free of controls and with automatic refresh.

Which data can come together in a dashboard?

All data eco2lot collects: meters and sensors, machine and plant controllers, building services and calculated KPIs from smartcalc. External sources such as weather data or PV forecasts can be integrated as well.

Are Dashboards the right fit for your task?

Describe your starting point and your goal — we get back to you with a concrete recommendation of matching features and solutions, plus a price indication.

Configure your solution
Esc or click outside to close