
Evaluation periods
Every calculation in smartcalc knows the same periods. Whether you need the quarter-hour value of yesterday or the year-on-year comparison of the last three years: it is the same calculation, only resolved differently — explained here once, centrally.
- 15 minutes, hour, shift, day, week, month, year
- Calculation cycle down to 1 minute — 15 minutes is the market standard
- Year-on-year comparison, periods, comparison mode
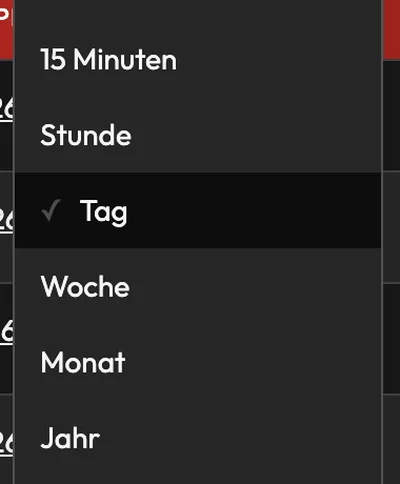
smartcalc processes time series data and provides calculated results in standardized periods: 15 minutes, hour, shift, day, week, month and year. An energy meter continuously delivers meter readings; smartcalc automatically calculates the 15-minute, hourly, shift, daily, weekly, monthly and yearly consumption from them. The same principle applies to feed, volume, sum, average and event counters, KPIs, status time, status to feed, status to volume and formulas. The periods are shared; the calculation logic stays that of the respective calculation type — a KPI, for example, divides sum A by sum B per period. Calculation happens per time unit: at the 15-minute cycle common in the market, in eco2lot down to 1 minute on request — formulas even as often as the raw data is recorded.
One counter, seven resolutions
The same calculation in seven resolutions
A single feed counter from a demo tenant, seven views: from the quarter hour to the period comparison. Every view has the same table with sum, minimum, maximum and average.
Activate comparison mode, choose a second date: August against September, day by day. Further periods come in via "Add date" — for previous year, previous month or a reference week.
The finest resolution: four values per hour. The basis for load profile, load peaks and the reconciliation with the grid operator.
The day in 24 bars: base load at night, start-up in the morning, peak in the afternoon.
The week in daily values: production days against weekend, calendar week as the period.
The month day by day — sum, minimum, maximum and average in the table.
The year in monthly values: seasonal profile and yearly sum at a glance.
Freely defined sections of a year — billing periods or heating seasons, for example — as an evaluation of their own.
What is inside the evaluation periods
The seven periods
- 15 minutes — the resolution of the load profile
- Hour and shift — the pace of the operation
- Day and week — the rhythm of production
- Month and year — the level of billing and reporting
Your benefitYou choose the resolution that fits the question — the calculation stays the same.
The calculation cycle
Every calculation arises per time unit — and that can be finer than 15 minutes:
- 15 minutes: the cycle of the energy industry and most energy management systems
- 1 minute: in eco2lot on request for all calculation types — load peaks and start-ups become visible
- Formulas calculate as often as the raw data is recorded, every second as well
- Coarser periods arise from the fine values — the level of detail is preserved
Your benefitWhat vanishes in the 15-minute average, the minute value shows.
Additional views
- Yearly overview: one value per year, several years side by side
- Year-on-year comparison: the months of several years set against each other
- Periods (yearly periods): freely defined sections, e.g. billing periods
- Custom: free period with selectable resolution
Your benefitPrevious-year comparison and billing periods with no recalculating.
Tools in every view
- Comparison mode: two and more periods as bars side by side
- Table with sum, minimum, maximum and average
- Switch base unit and display unit, e.g. kWh → MWh
- Data table with comments, CSV export and load duration curve
Your benefitThe view delivers the number and the evidence.
What applies to all calculation types
- Feed, volume, sum, average and event counters
- KPI, status time, status to feed, status to volume
- Formula
- The calculation logic stays that of the calculation type: a KPI divides sum A by sum B per period, a feed counter forms the difference
Your benefitShared periods, individual calculation logic — both together make results comparable.
Afterwards you can …
-
You switch between quarter hour and year while the calculation stays the same.
-
Previous year, previous month and reference week sit side by side via comparison mode.
-
Every view delivers sum, minimum, maximum and average as a table — exportable as CSV.
What you should know about the evaluation periods
Which periods can be evaluated?
15 minutes, hour, shift, day, week, month and year — the same for all smartcalc calculation types. Plus the views yearly overview, year-on-year comparison, periods and custom periods.
Do I have to create a calculation of its own for every period?
One calculation is enough. You choose the resolution in the evaluation; eco2lot delivers the same calculation as 15-minute, hourly, daily or yearly value.
How finely does smartcalc calculate?
Per time unit, down to 1 minute on request — for all calculation types. The 15-minute cycle is the market standard. Formulas calculate even as often as the raw data is recorded, so every second as well. The coarser periods up to the year arise from these fine values.
Are all calculation types aggregated the same way?
The periods are shared, the calculation logic stays individual. A feed counter forms the difference of the meter readings per period; a KPI divides sum A by sum B per period; a status time sums the duration per state.
What does the comparison mode show?
Two or more periods as bars side by side — August against September day by day or this week against the reference week, for example. Further periods come in via "Add date".
What are periods?
Freely defined sections of a year, for example billing periods of the energy supplier or heating seasons. The evaluation "yearly periods" shows one value per period.
Can I export the values?
Yes. The data table of every view offers the CSV download with the chosen resolution — for everything that goes on outside eco2lot.
Goes well with this



Are the evaluation periods the right fit for your task?
Describe your starting point and your goal — we get back to you with a concrete recommendation of matching features and solutions, plus a price indication.
Configure your solution