
The features of eco2lot at a glance
One data basis, all features — from personal dashboards via smartcalc and Sankey diagrams to automation and open interfaces. Every feature leads one level deeper: with details, examples and answers.
eco2lot is the digital control centre for technical operations. Its features cover the whole way of the data: connect and manage devices and data points, make them visible in personal dashboards and on maps, calculate with smartcalc, analyze with Sankey diagrams and reports, monitor via alarms and SCADA diagrams — and actively control within safety limits via automation. Wiki, Maja and open interfaces turn the platform into a daily working tool.
Everything your operation needs
Dashboards
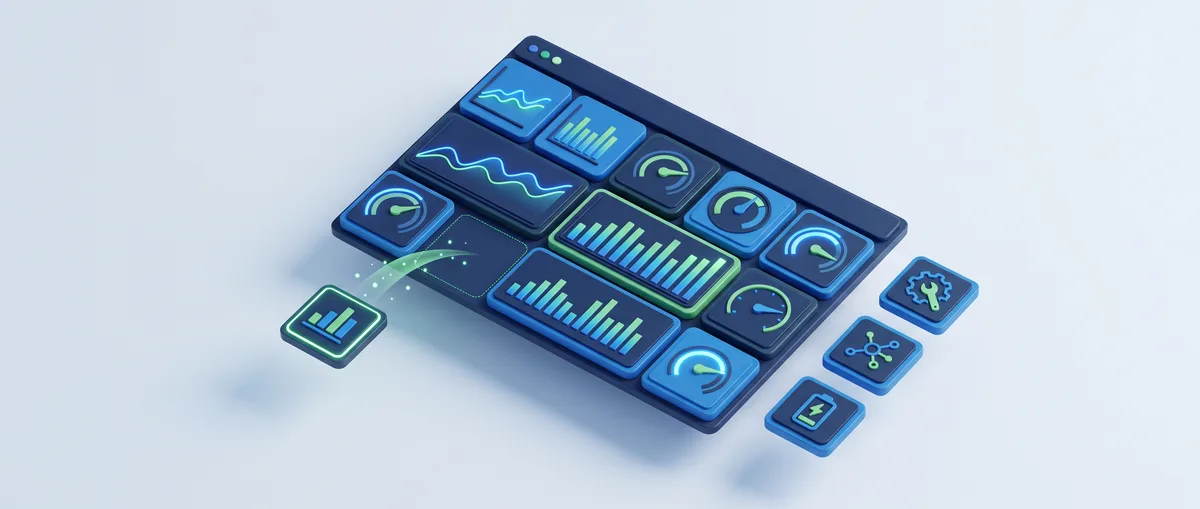
From the single machine to the whole company: dashboards show every role exactly the information its task needs — plus personal favourites.
More about Dashboards →
Alarms
eco2lot keeps an eye on your data: limit exceeded, device silent, consumption unusual — the people in charge find out automatically, by email or push.
More about Alarms →
Map view
All sites on one map: plants, properties and installations with status and KPIs at a glance — the fastest entry point with several sites.
More about Map view →
Devices
Every measuring point, every machine and every plant is a device in eco2lot — with live data, history, alarms, calculations, documents and tasks in one place. The overview shows within seconds what is running and where action is needed.
More about Devices →
Data points
A data point is the smallest unit of information in eco2lot: temperature, power, meter reading or machine status — stored as a time series, with unit, history and quality. Directory, live chart, data editor, filters and comments turn raw values into a reliable data base.
More about Data points →
smartcalc
The calculation layer of eco2lot: ten calculation types turn meter readings, status and volumes into consumption, KPIs and assignments — every result a data point again.
More about smartcalc →
Sankey diagrams
A Sankey diagram shows where energy and quantities come from and where they go – the wider the band, the larger the amount. In eco2lot you click from the overall view into sub-nodes and linked Sankeys down to the single consumer.
More about Sankey diagrams →
flow
Connect workflows visually: data points, calculations and actions are linked into data flows with building blocks — logic emerges by connecting instead of programming.
More about flow →
Report Studio
Reports directly from your eco2lot data: drag charts, Sankeys, tasks and images onto the report page, save – and have them sent automatically as PDF by e-mail on a schedule or when an event occurs.
More about Report Studio →
SCADA
Plant diagrams with live values: visualize, monitor and operate processes — every intervention safety-limited and documented in the audit trail.
More about SCADA →
Wiki
The technical memory of your operations: asset profiles, wiring diagrams, test reports, maintenance history and lessons learned — anchored directly to plants and data.
More about Wiki →
Maja
The AI assistant in eco2lot: you describe what you need — Maja opens devices and data, prepares views, explains features and executes released actions. Your data stays in eco2lot.
More about Maja →
Administration
Access and responsibility cleanly regulated: users, roles and permissions (RBAC), SSO/AD integration, sites and tenants — every change traceable.
More about Administration →
Integrations
eco2lot works with your tools: Grafana for your own visualizations, OPC Router, Node-RED and n8n for automations — your data stays open.
More about Integrations →
Automation
From analysis to action: control strategies — avoid peak loads, increase self-consumption, reduce base load, keep schedules, anomaly-to-action.
More about Automation →
Interfaces
Meters, machines, buildings, sensors, PV systems or software: eco2lot connects them via open industrial, IoT and software interfaces — directly, via eco2node or via manufacturer portals.
More about Interfaces →
Design
The platform in your look: adapt logo, colors and themes — up to the complete white-label variant for manufacturers and partners.
More about Design →For the connection on site and your own data paths there are separate products: eco2node (edge) and eco2iot (hardware).
Afterwards you can …
The features are not the goal — what your team can do with them is:
-
See every plant, every meter and every sensor in one system — live and historical.
-
Calculate KPIs such as energy per unit automatically instead of maintaining them in Excel.
-
Peak loads stop coming as a surprise: forecast, alarm and countermeasure work together.
-
Generate reports for ISO 50001, cost centres and CO₂ at the push of a button — from running operations.
-
Faults reach the right person at the right time — with escalation and acknowledgement.
-
Control plants actively and within safety limits — from setpoint to schedule, with audit trail.
What you should know about the features of eco2lot
Which features does eco2lot have?
eco2lot covers the whole way from measurement to control: personal dashboards, alarms, maps, device and data point management, the calculation engine smartcalc, Sankey diagrams, flow, Report Studio, SCADA plant diagrams, the wiki as technical memory, the assistant Maja, administration, integrations (Grafana, OPC Router, Node-RED, n8n), automation with five control strategies, open interfaces (MQTT, OPC UA, Modbus, M-Bus, LoRaWAN, REST — plus MCP, through which AI assistants evaluate your data) and customizable design. Every feature has its own detail page; the English pages are added step by step.
Do I have to buy all features?
No — you start with the features your task needs today and add further ones at any time. All features work on the same data basis: data connected once is immediately available to every feature added later.
How does my data get into eco2lot?
Via the open interfaces: MQTT, OPC UA, Modbus TCP/RTU, M-Bus, LoRaWAN and REST API — vendor-independent, also for existing plants. On site at the plant, eco2node takes care of the secure connection: it buffers data locally and transmits it encrypted, even across connection drops.
Does eco2lot replace a SCADA system or a BMS?
eco2lot complements existing systems at first: it reads SCADA, building management systems and controllers via open protocols and brings the data together. Many tasks of classic systems — plant diagrams, alerting, reports, safety-limited interventions — are covered by the platform, so you can replace legacy systems step by step if you want to.
How do the features relate to the solutions Energy, Production, Buildings and Control?
The four solutions are task-oriented compositions of the features. eco2lot Energy, for example, uses smartcalc, Sankey diagrams and Report Studio for energy KPIs; eco2lot Control combines alarms, SCADA and automation. The feature basis is always the same — which is why solutions can be combined freely.
Which features does your task need?
Describe your starting point and your goal — we get back to you with a concrete recommendation of matching features and solutions, plus a price indication.
Configure your solution