
Feed counter
A meter shows what has passed through in total. You want to know what was consumed in this hour, this shift, this month. The feed counter calculates the difference — continuously and for every period.
- Electricity, gas, water, heat, steam — every continuous meter reading
- Consumption per 15 minutes, hour, shift, day, week, month, year
- Result as a new data point for KPIs and dashboards
In eco2lot, a feed counter evaluates a continuously rising meter reading. A power meter shows a total reading that keeps growing. The actual consumption of a period sits in the difference of two meter readings: 10,250 kWh in the evening minus 10,000 kWh in the morning yields 250 kWh. The feed counter forms this difference automatically for every evaluation period — for electricity, gas, water, heat, steam and every other continuous meter reading.
The calculation scheme
From the meter reading to the consumption per period
Three views of the same feed counter: the daily profile as hourly values, the data table with selectable resolution and the consumption together with the outdoor temperature.
24 bars, one day: base load at night around 45 kWh, peak at 2 and 3 pm with 137 kWh. Sum, minimum, maximum and average stand in the table.
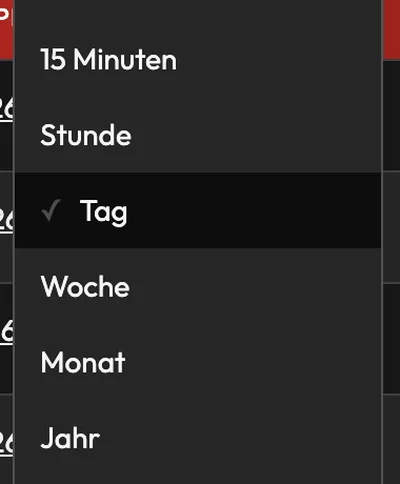
The same values as a table: resolution from 15 minutes to year via dropdown, comment per row, CSV download for everything that goes on outside.
The daily consumption as bars, the outdoor temperature as a line: the cooler the days, the higher the consumption — the correlation becomes visible with zero arithmetic.
What is inside the feed counter
What the feed counter is
- The evaluation of a continuously rising meter reading
- Typical: energy meter, gas meter, water meter, heat meter, steam meter
- Also for operating hour counters and other cumulative values
Your benefitThe meter stays as it is — eco2lot takes over the arithmetic.
Which data it uses
- One data point with a continuous meter reading
- Timestamp of every value from the history
- Base unit and display unit (e.g. kWh → MWh)
Your benefitOne data point is enough; you switch the unit freely in the evaluation.
What eco2lot calculates
- The difference of two meter readings per period
- Consumption per 15 minutes, hour, shift, day, week, month, year
- Sum, minimum, maximum and average per evaluation
- Comparison of several periods and years
Your benefitA total reading becomes consumption values in every resolution.
What benefit arises
- Consumption with no reading off and no Excel differences
- Basis for KPIs such as kWh per unit
- Input for sum counters across lines and halls
- Assignment to status and order with status to feed
Your benefitThe feed counter is the most frequent starting point of every energy evaluation.
Typical feed counters
Three meters, one principle: the meter counts up continuously, the feed counter delivers the consumption per period.
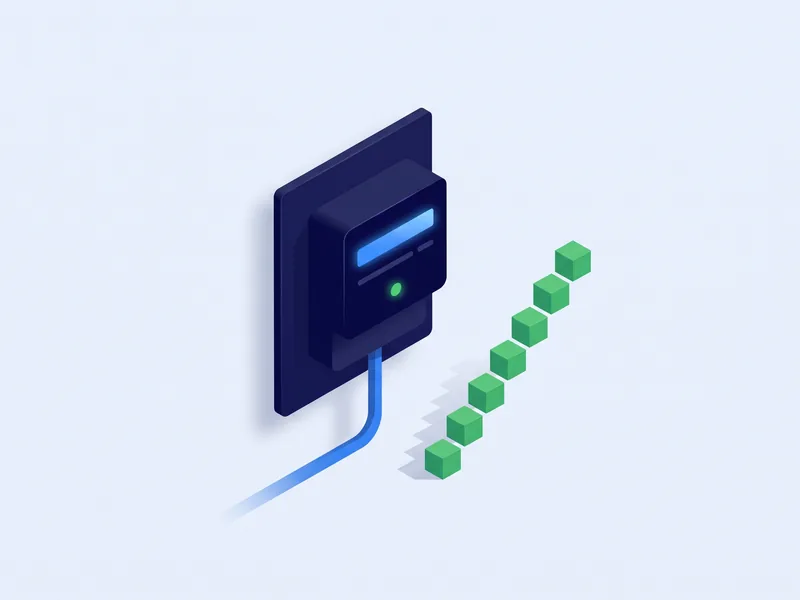
Power meter
Meter reading in the morning 10,000 kWh, in the evening 10,250 kWh: 250 kWh consumption. As hourly values the feed counter shows base load, start-up and load peak — the basis for kWh per unit and load analyses.
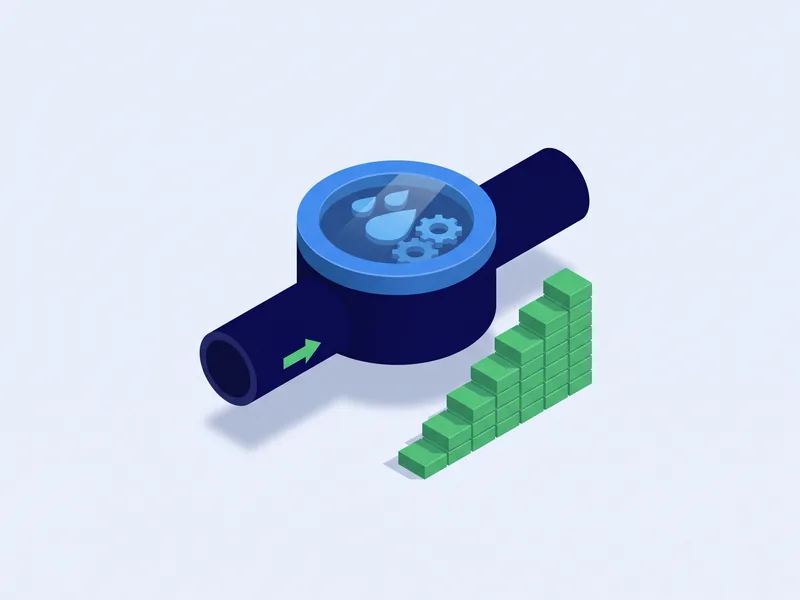
Water meter
Meter reading 12,500 m³, the next morning 12,580 m³: 80 m³ daily consumption. A nightly base consumption that never drops to zero is the classic hint at a leak.
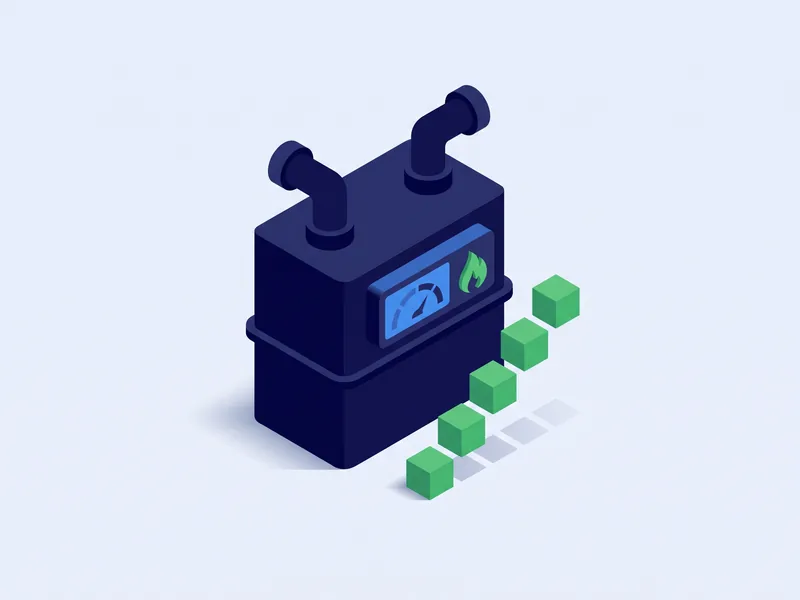
Gas meter
The gas meter counts in m³; the feed counter delivers the consumption per day or heating season. By formula this becomes energy in kWh — and with the outdoor temperature the weather-adjusted comparison.
Afterwards you can …
-
You see the consumption per hour, shift, day or month instead of only a meter reading.
-
Base load, load peaks and weekend consumption become visible with zero arithmetic.
-
The consumption is available as a data point for KPIs, sums, alarms and reports.
What you should know about the feed counter
What is a feed counter?
The evaluation of a continuously rising meter reading. The consumption of a period is the difference of two meter readings — the feed counter forms it automatically for every evaluation period.
Does feed mean material feed at a machine?
In eco2lot, feed means the continuous increase of a meter reading. It refers to electricity, gas, water, heat or steam meters and other cumulative values.
Which media suit the feed counter?
Everything with a continuous meter reading: electricity, gas, water, heat, steam, compressed air volume, operating hours. The unit is switched freely in the evaluation, from kWh to MWh, for example.
How does the feed counter become a KPI?
With the calculation type KPI: the feed counter (e.g. power consumption) is divided by a second counter (e.g. production volume) — sum by sum per period. Result: kWh per unit.
What happens when a meter is replaced?
A new meter starts with a different reading. In eco2lot the history of the data point is kept; the change is documented at the data point. We clarify the details with you during setup — the relationships of the data point show beforehand which calculations are affected.
Can I place an alarm on the consumption?
Yes. The calculated consumption is a data point like any reading. An alarm reports when the hourly consumption exceeds a limit, the night consumption sits above the expected base load or a meter suddenly delivers zero difference.
Goes well with this


Is the feed counter the right fit for your task?
Describe your starting point and your goal — we get back to you with a concrete recommendation of matching features and solutions, plus a price indication.
Configure your solution