
Live charts
Power consumption over a day, temperature curve over a week, production volume over a month: live charts answer the most frequent question in operations — how has a value developed, and when did something happen?
- Live values and history in one chart
- Zoom from the year to the minute
- Overlay and compare periods
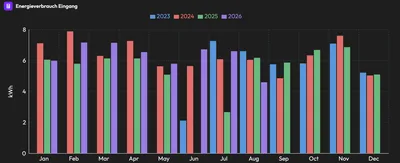
A live chart is a time chart in eco2lot: it shows how a reading has developed over time — from the last minute to several years. Current values stream in live, historical values come from the data base. With zoom and period selection you switch from the yearly overview into the single day.
From the yearly overview into the single day
Three live charts from a demo tenant: a temperature over the week, the grid voltage per phase and a room temperature with a clear jump.
The value rises, holds and falls — changes to the setpoint are immediately traceable.
Three phases, input and output in one chart: one phase sits permanently below the others — a hint for the electrician.
A jump from 22 to 32 degrees on Tuesday evening: with zoom the chart shows the exact minute — and the comment at the dashboard the cause.
What is inside Live charts
What a live chart shows
- Current readings streaming in live
- Historical values from months and years
- Several values in one chart
- Line, area and column display
Your benefitTrends, jumps and outliers are visible with zero arithmetic.
How you work with it
- Choose the period freely: hour, shift, day, week, year
- Zoom with mouse or finger
- Overlay periods — this week against last week
- Read values exactly with the mouse pointer
Your benefitFrom the yearly overview into the single minute — in two clicks.
Typical applications
- Energy: power consumption and load profile over the day
- Production: machine power and piece count per shift
- Buildings: temperature and pressure curves of the heating
- Heat: heat output and flow over the heating season
Your benefitOne tool for energy, production and buildings — the same operation everywhere.
Examples from practice
Questions a live chart answers in seconds.
Power consumption over a day
When does the base load start to rise, and when does it drop in the evening? The chart shows the daily profile of every hall.
Temperature curve
Does the cold room hold its temperature at night as well? Deviations show up as a spike.
Machine power
Does the press run evenly or with interruptions? Every standstill is a gap in the curve.
Pressure curve
Does the compressed air network pressure drop at night? A slow decline points to leaks.
Heat output
How does the heat pump react to cold nights? Output and outdoor temperature compared.
Production volume
Does the line reach the shift target? The curve shows progress against the goal.
Afterwards you can …
-
Recognize trends and anomalies before they become a problem.
-
Compare periods — today against yesterday, this week against last.
-
Pin down the moment of a fault to the minute.
What you should know about Live charts
How current are the values in the live chart?
As current as the data source: values from controllers and meters stream in at second to minute intervals depending on the connection. The chart refreshes automatically while the page stays open.
How far back does the history go?
All values in the data base are available — typically several years. For long periods eco2lot condenses the values automatically so the chart stays fast.
Can I display several values with different units?
Yes. For different units and orders of magnitude there are MultiCharts with several axes. A simple live chart suits values with the same unit.
Goes well with this



Are Live charts the right fit for your task?
Describe your starting point and your goal — we get back to you with a concrete recommendation of matching features and solutions, plus a price indication.
Configure your solution