eco2lot feature · Build reports like with building blocks

Report Studio

Assemble reports by drag and drop directly from your eco2lot data – and have them sent automatically as PDF by e-mail – on a schedule or when an event occurs.

  • Drag building blocks onto the report page – without programming
  • Save reports, use them as templates and reuse them with current data
  • Send as PDF by e-mail – on a schedule or triggered by an event
my.eco2lot.de · Report Studio Editor · energy report
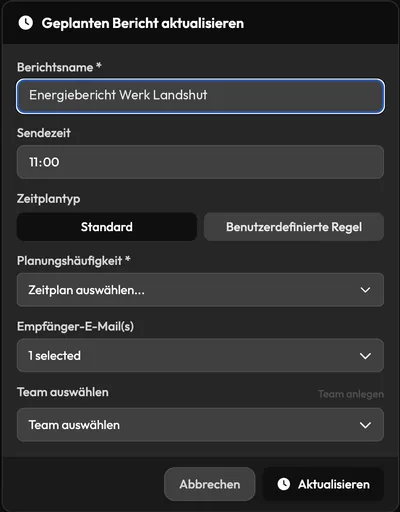
Dialog “Update scheduled report”: report name, send time 11:00, schedule type standard or custom rule, scheduling frequency, recipient e-mails and team
What is Report Studio in eco2lot?

Report Studio is the reporting feature of eco2lot. In it you assemble reports from the data that already exists in eco2lot: readings, meters and KPIs as line or bar chart with statistics table, Sankey diagrams, tasks and images. You drag the building blocks onto the report page, arrange them and save the report. From then on eco2lot can send it itself as PDF by e-mail – on a schedule, for example every first Monday of the month at 11:00, or when an event such as an alarm or a threshold violation occurs. The monthly report that used to cost a day is created from the same data you work with every day – and arrives on its own.

How it works

Build reports like with building blocks

Build reports like with building blocks On the left the toolbar with six building blocks: line, bar, group, Sankey, tasks and image. The bar building block is dragged by drag and drop onto the report page on the right. There a title, a line chart, a Sankey and a task list already stand one below the other; the dashed area shows where the new building block lands. The report page is at the same time the structure of the later report. Toolbar · building blocks Line Bar Group Sankey Tasks Image Bar Drag & Drop select, drag in, arrange – done. Report page · your report Energy report July Grid supply · July 325 MWh Grid supply per day · MWh SumMeanMaximum 32510.514.2 Portrait · page 1
On the left the toolbar with the available building blocks, on the right the report page. You choose an element – for example a bar chart –, drag it onto the page, place it where you want it and adjust the presentation. Add further elements, save the report, automate it if needed. What you assemble on the report page is the structure of your later report – without programming and without detours through other programs.
Where to start

Every recipient needs a different report

The same data foundation, different questions. In Report Studio you build the matching report for every audience – and send it to exactly the people who need it.

Management

A few KPIs, two or three charts, a short assessment – once a month, automatically.

Energy management

Consumption per area, KPIs, Sankey and statistics tables – as monthly and annual report, also as the data basis for ISO 50001.

Production and plant management

Production volume, energy per unit, downtimes and machine status – weekly or after an event.

Customers, contractors, service providers

A clearly structured, presentable report with the same layout for every site and every period.

One report per question – built from the same building blocks, distributed to different recipients.

What it looks like

From building block to scheduled report

Three real views from a demo tenant: the toolbar with the saved reports, a bar chart with included statistics table and the dialog used to schedule a report.

Toolbar · Saved & Scheduled
Step 1: choose a building block

The toolbar holds the building blocks: line, group, bar, Sankey, tasks and image. Below them color, font, template and layout for the design. To the right lie all saved and scheduled reports in folders – search, create, open.

Building block · bars + statistics table
Step 2: place and adjust

The building block sits on the report page and shows the grid supply per day. With “Include statistics table” the daily values appear below the chart – the quick overview at the top, the figures to look up below. Further building blocks follow underneath.

Schedule · custom rule
Step 3: schedule and send

Set the send time, schedule type “Standard” for daily, weekly or monthly – or “Custom rule” with cycle, mode, day types, months and week number, for example the first working day of the month. The schedule preview shows the next dates, recipient e-mails and teams are stored.

Create once – send automatically

On demand, on a schedule or when an event occurs

A saved report is the foundation. How it reaches its recipients is up to you: you open it yourself, eco2lot sends it following a time pattern – or an event in eco2lot triggers the dispatch. Time-driven and event-driven reporting are two separate paths that can be combined.

Schedule or event – the report arrives automatically At the top a saved report. Two routes lead from it: on the left the schedule with the question “When?” – daily, weekly, monthly or individually –, on the right the event with the question “What has to happen?” – alarm, threshold violation or status change. Both routes lead into the automatic dispatch: refresh data, create report, send. At the bottom the recipients: management, energy team, plant management, customer. Saved report built once, usable again and again Schedule · when? Following a time pattern daily · weekly · monthly weekday · individual schedule Event · what has to happen? When an event occurs Alarm · threshold · status change starts the predefined report Automatic dispatch refresh data → create report → send Recipients Management Energy team Plant management Customer
The saved report is the starting point. The schedule answers the question “When should the report be sent?” – daily, weekly, monthly or following an individual pattern. The event answers “What has to happen for the report to be sent?” – an alarm, a threshold violation or a status change. In both cases eco2lot refreshes the data, creates the report as PDF and sends it by e-mail to the stored recipients.

On demand – saved report

You open a saved report, refresh the data to the desired period and export it. The structure stays, the figures are current.

  • Folder structure for saved reports
  • Refresh instead of rebuilding
  • Export and pass on
  • Use as a template for further reports

When? Whenever you need it – for example before a meeting.

Time-driven – scheduled report

You store a time pattern and the recipients. eco2lot creates the report on the date from the current data and sends it – without anyone having to think of it.

  • Schedule type “Standard”: daily, weekly, monthly – with a fixed send time
  • Schedule type “Custom rule”: cycle, mode, day types, months, week number – for example the first working day of the month at 11:00
  • The schedule preview shows the next send dates; report day follows the operating day instead of the calendar day (shift logic)
  • Recipient e-mails and teams per report; dispatch as PDF

When? On the set date – the monthly report runs on its own.

Event-driven – triggered by an event

An event in eco2lot starts the report – an alarm, a threshold violation or a status change. Instead of a short notification the recipient then receives the predefined report with the matching readings, charts and information about the event as PDF by e-mail.

  • Triggers: alarm, threshold violation, status change
  • The predefined report is created and sent when the event occurs
  • Relevant readings and charts deliver the data context directly
  • Can be combined with the regular schedule

What has to happen? The event – inform exactly when something happens.

In detail

What is inside Report Studio

The building blocks of a report

The toolbar holds the elements you drag onto the report page. Each shows a different view of your data.

  • Line – developments over time of readings, meters and KPIs
  • Bar – comparisons per day, week or month, optionally with a statistics table below
  • Sankey – energy or material flows of the site
  • Tasks – measures and open items from eco2lot
  • Group and image – combine building blocks, insert photos or schematics

Your benefitOne data foundation, many presentations: you choose the presentation to match the question – the quick overview at the top, the values to look up below.

Real eco2lot data

The contents of a report come directly from the eco2lot data foundation. Exporting, copying into Excel and building new charts there is a thing of the past.

  • Measured data and historical curves from data points
  • Meters, calculated values and KPIs from smartcalc
  • Sankey evaluations and further results from eco2lot
  • The same evaluation periods as in smartcalc – day, week, month, year

Your benefitReports are created where the data and analyses live – without duplicate data maintenance.

Design and layout

Reports can be adapted to recipient and purpose. The focus remains: present data clearly and in a structured way.

  • Portrait for the classic report with sections one below the other
  • Landscape for wide charts, Sankeys and long statistics tables
  • Color, font, template and layout as page options; zoom for working on details
  • Technical report with many tables, management report with a few KPIs, customer report ready to present

Your benefitOne tool for auditor, management and customers – everyone gets the report in the form they want to read.

Save, templates, refresh

Built once, reused regularly: the structure stays, the data changes with the period.

  • Saved reports in folders – search, create, share
  • Templates for uniform monthly reports, several sites with the same layout, standardized customer reports
  • Refresh: the August energy report becomes the basis for September
  • “Saved & Scheduled”: all reports and their schedules at a glance

Your benefitUniform reports, without starting from scratch every time.

Schedule and send

In Report Studio “schedule” means: automate a reporting process, rather than opening a report manually later.

  • Send time and schedule type: standard (daily, weekly, monthly) or custom rule (cycle, mode, day types, months, week number)
  • Trigger dispatch by events: alarm, threshold violation, status change
  • Store recipient e-mails and teams per report – from the energy team to the auditor
  • Dispatch and export as PDF

Your benefitReporting becomes an automated flow of information: the right information at the right time to the right recipient.

Several evaluations in one report

A report is more than a collection of individual charts: it presents the relationships between the data in an understandable way.

  • Total electricity consumption, compressors and production consumption side by side
  • KPI kWh per unit right next to the consumption
  • Sankey of the energy distribution in the same report
  • Tasks in the report: what follows from the figures and who takes care of it

Your benefitShow figures and explain relationships – in one document.

One level deeper

Six reports from practice

Every report can be assembled to match the question – from the same building blocks, for different recipients and time patterns. Six typical examples.

Energy report – monthly, automatic

Total electricity consumption as bar chart per day, consumption of the compressors, KPI kWh per produced unit, Sankey of the energy distribution at the site, plus the open tasks of the energy team. Schedule monthly, 11:00: eco2lot refreshes the data, creates the PDF and sends it by e-mail – the monthly report runs on its own.

Event-driven report – when something happens

An alarm, a threshold violation or a status change triggers the predefined report. It contains the relevant readings, charts and information about the event. The recipient thus gets the matching data context instead of a short notification – and can immediately assess what happened.

Management report – few figures, clear message

Total energy, change versus the previous month, energy per unit, largest consumer, conspicuous area – for example 325 MWh, −4.2 %, 0.48 kWh/unit, production line 2, compressed air (example values). Plus two or three charts and a short assessment. Monthly as PDF to management: many readings become a few decision-relevant pieces of information.

Production report – production and energy together

Production volume, energy consumption, consumption per unit, downtimes, machine status and the development over the period – from volume counter, status time and KPI. Weekly or after a relevant event to production management.

Building report – for operators and contractors

Electricity, heat and water consumption, heat pump KPIs, temperature development, energy distribution and special events. One report for facility management, contractor or operator – with the same layout for every property.

Corporate report – several sites compared

Munich, Hamburg, Berlin: consumption, costs, KPIs and development per site in a standardized structure. Built once as a template, reused for every site, sent automatically on a regular basis.

From reading to sent report

Create. Automate. Send.

Devices record data, smartcalc and Sankey turn them into KPIs and flows. In Report Studio you drag these results together into a report by drag and drop and save it. A schedule or an event triggers the dispatch – eco2lot refreshes the data, creates the PDF and delivers it by e-mail to the recipients. From measurement to information everything stays in one shared data world.

  1. Data
  2. Analysis
  3. Drag & drop
  4. Report
  5. Schedule · event
  6. Recipients

Dashboard and Report Studio complement each other: the dashboard is for observing and analyzing – “What is happening right now?”. Report Studio is for documenting, automating and communicating – “What happened in the period, and who should receive it when?”.

From reading to sent report Six stages: data is recorded, smartcalc and Sankey analyze it, by drag and drop a report emerges from it, which is saved and used as a template, a schedule or event automates it, the recipients receive it automatically. Below the distinction: a dashboard answers “What is happening right now?”, Report Studio “What happened – and who receives it when?”. The same data foundation as all eco2lot features Data record Analysis smartcalc · Sankey Drag & drop assemble Report save · template Schedule · event automate Recipients send automatically Both complement each other Dashboard “What is happening right now?” Report Studio “What happened in the period – and who gets it when?”
Your outcome

Afterwards you can …

  • You assemble reports by drag and drop from line and bar charts, statistics tables, Sankeys, tasks and images – without programming.

  • You use the data that already exists in eco2lot directly in the report – without export and without duplicate data maintenance.

  • You save reports, use them as templates and refresh them for the next period instead of rebuilding them.

  • You have reports sent as PDF by e-mail – on a schedule or triggered by alarm, threshold or status change.

  • You supply management, energy team, production and customers with the report that fits each of them – in portrait or landscape.

Frequently asked questions

What you should know about Report Studio

What is Report Studio?

The reporting feature of eco2lot: a visual workspace in which you build reusable, presentable reports from existing eco2lot data – and then have them sent automatically on a schedule or when an event occurs. It is more than an export: you build, save, automate and send reports directly in eco2lot.

How do I create a report?

Select an element in the toolbar, drag it onto the report page, place it at the desired position, adjust the presentation, add further elements, save the report – and if needed store a schedule or an event for the dispatch.

Do I need programming skills?

No. Reports are neither programmed nor elaborately configured. You drag the desired building blocks onto the page and arrange them – like with building blocks.

Which contents can a report contain?

The building blocks from the toolbar: line, bar, group, Sankey, tasks and image. Line and bar charts can be extended by a statistics table. The data for them come from data points, meters, smartcalc calculations and Sankey evaluations.

Can I combine charts and tables?

Yes. A bar chart can for example show the consumption over a month; with “Include statistics table” the table with the values appears below it. So the reader grasps the overview at the top and finds the values below – and several evaluations stand in one shared report.

Can I include Sankey diagrams and smartcalc results?

Yes. Sankey diagrams are a building block of their own, for example for the energy distribution of a site. Meters, KPIs such as kWh per unit and formula results from smartcalc are available as results, charts or tables.

Can I save reports and use them as templates?

Yes. Reports are stored in folders under “Saved & Scheduled”. A report built once serves as a template for further ones – for example uniform monthly reports, several sites with the same layout or standardized customer reports.

Do I have to create a monthly report from scratch every time?

No. The structure remains, the underlying data are refreshed for the new period: energy report July, August, September – same structure, current figures. As a scheduled report this runs without your involvement.

Can eco2lot send reports automatically?

Yes. A saved report is sent as a scheduled report by e-mail – as PDF to the stored recipient e-mails or teams. Schedule type “Standard” covers daily, weekly and monthly; the “Custom rule” allows cycle, mode, day types, months and week number, for example the first working day of the month at 11:00. On the date eco2lot refreshes the data, creates the PDF and sends it.

Can an event trigger a report?

Yes. An alarm, a threshold violation or a status change in eco2lot can trigger the dispatch. The recipient then receives the predefined report as PDF with the matching readings and charts – the data context of the event instead of a short notification.

What is the difference between time-driven and event-driven reporting?

Time-driven answers the question “When should the report be sent?” – for example every first Monday of the month. Event-driven answers “What has to happen for the report to be sent?” – an event occurs, the report is triggered and sent. Both paths can be combined for the same report.

What is the difference between saved and scheduled reports?

A saved report is the built structure that you can open, refresh and export at any time. A scheduled report is a saved report with send time, schedule or event and recipient e-mails – “scheduling” means automating the reporting process. Both appear in the list “Saved & Scheduled”.

Can I create reports in portrait and landscape and export them as PDF?

Yes. Portrait suits the classic report with sections one below the other, landscape suits wide charts, Sankeys and long statistics tables. Finished reports can be exported as PDF and passed on – to management, energy management, production management, customers or service providers.

What is the difference between Report Studio and dashboard?

The dashboard is for ongoing observation: “What is happening right now? How are the values developing? Where is action needed?” Report Studio is for structured documentation and automated distribution: “What happened in the period? Who should receive it? When or on which event?” Both use the same data and complement each other.

Is Report Studio suitable for energy reports according to ISO 50001, CO₂ balances and cost center reports?

Yes, as data basis and documentation: consumption, KPIs (EnPI), Sankey and meters come from smartcalc and the data points, the report documents them in a structured and regular way – for energy and environmental reports, cost center reports, CO₂ balances (scope 1 and 2) and the energy audit. The audit thus accesses the same data as your daily business.

Can reports follow the operating day instead of the calendar day?

Yes. With shift logic the report day follows your operating day – for example 06:00 to 05:59. This way daily and shift reports match the reality in production.

Can I get report data into Excel templates or other systems?

For familiar Excel templates and systems such as SAP or BI tools eco2lot provides the data via interfaces and integrations. Report Studio itself delivers the finished, presentable report as PDF – exported or sent automatically by e-mail.

Does Report Studio fit your task?

Describe your starting point and your goal — we get back to you with a concrete recommendation of matching features and solutions, plus a price indication.

Configure your solution
Esc or click outside to close