
MultiCharts
Outdoor temperature, heat consumption and flow temperature of a heating plant in one picture. Or production volume and energy consumption on top of each other. MultiCharts show what the single reading keeps quiet: the correlation.
- Several time series on one time axis
- Different units on their own axes
- Compare machines and sites directly
A MultiChart shows several data series together in one chart — also with different units on several axes. This makes visible how values relate: outdoor temperature and heat consumption, production volume and energy consumption, the power of several machines compared.
Recognize correlations
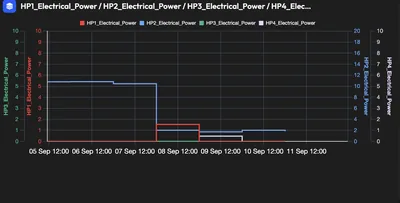
Three MultiCharts from a demo tenant: four heat pumps compared, phase currents of two measuring points and a year-on-year comparison over four years.
Four units, four colours: do they run together or alternately? The chart shows it with zero arithmetic.
Input and output of two measuring points in one picture — differences between the phases are immediately recognizable.
Four years per month side by side: consumption in May and July 2025 falls out of line — a case for the comment at the dashboard.
What is inside MultiCharts
What MultiCharts show
- Several time series in one view
- Different readings and units
- Several machines or plants compared
- Several sites on one time axis
Your benefitThe look at the correlation replaces clicking back and forth between charts.
How you work with it
- Add and hide data series with one click
- Own axis per unit — kW, °C, units, bar
- Choose colours and display per series
- Zoom and period selection as in the live chart
Your benefitA hunch becomes a provable correlation within minutes.
Typical questions
- Does energy consumption rise with production volume — or independently of it?
- Does the flow temperature react correctly to the outdoor temperature?
- Do two compressors run simultaneously although one would suffice?
- Do two identical sites behave the same?
Your benefitFind causes instead of managing symptoms.
Examples from practice
Heating plant
Outdoor temperature, heat consumption and flow temperature together. Does the heating curve fit, or is it run too warm in mild weather?
Production and energy
Production volume and energy consumption on top of each other. If energy deviates at the same piece count, a plant is working inefficiently.
Compressed air
Network pressure, compressor power and consumption: shows whether the pressure is kept unnecessarily high.
Site comparison
Two plants with the same production on one axis — differences in base load behaviour become visible.
Afterwards you can …
-
Prove correlations between energy, production and weather.
-
Compare identical machines and sites objectively.
-
Find inefficient plants that look inconspicuous in the single chart.
What you should know about MultiCharts
How many data series fit into a MultiChart?
Technically many — three to six make sense. For more series, the comparison via tables or several MultiCharts side by side in the dashboard is recommended.
How are different units displayed?
Every unit gets its own axis, left or right. Kilowatts, degrees Celsius and piece counts stay readable this way, with no series squashing another.
Can I share the MultiChart with colleagues?
Yes. The MultiChart is part of a dashboard and is shared with it — the permissions of the dashboard apply.
Goes well with this



Are MultiCharts the right fit for your task?
Describe your starting point and your goal — we get back to you with a concrete recommendation of matching features and solutions, plus a price indication.
Configure your solution